Hayden Ball
My contribution to the project was focused on two areas: the project website and working with Roy to design and build the sensor hardware.
Hardware
The hardware element of the project consisted of designing sensors for the health vest, installing them into the vest, and transferring data from the sensors to the Android application which could then upload the data for further processing and display.
The final design includes electrodes and analog filtering circuitry to acquire an electrocardiogram (ECG) of the wearer, and a sensor to allow monitoring of the wearer's temperature.
The electrodes and temperature sensor are connected to a "belt pack" which contained the ECG filtering circuit, a simple potential divider for the temperature sensor, and the nRF51 Development Kit (nRF51-DK). The NRF51-DK provides an easy interface to the nRF51822 microprocessor, which includes an analog to digital converter (ADC) and Bluetooth Low Energy transceiver.
Note: While efforts have been made to distinguish in the following sections where "work" was exclusively carried out by either myself or Roy, a large amount of time was spent working together to overcome the challenges described.
ECG Circuit
One of the more technically challenging aspects of the project was designing and building a circuit for obtaining a clean ECG trace.
An ECG shows the change in electrical potential between two points on the body caused by the depolarisation and repolarisation of different heart muscles.
At first, this may appear to be a trivial problem to solve - we simply need to build an amplifier to amplify the difference in potential between two electrodes attached to the body. Unfortunately, there are also a number of challenges to overcome.
The differential signal we are trying to obtain is in the order of 500μV, meaning a gain of around 30dB must be used to obtain a usable signal. This, as is to be expected with high gain amplifiers, introduces a large amount of noise into the signal.
As that the output of the circuit is sampled at 50Hz (discussed in more detail in the "mbed programming" section below), one must ensure that frequencies beyond 25Hz are sufficiently filtered out to avoid aliasing.
While high-frequency components of an ECG trace can sometimes be of interest, the maximum frequency of the basic QRS sequence is 10Hz. Roy and I decided to use a filter with a cut-off frequency slightly above 10Hz, as this should be sufficient to avoid aliasing and also significantly reduces the amount of noise seen in the signal.
Roy was responsible for the initial circuit design (including filtering and isolation inspired by Jason Nguyen's "Homemade Electrocardiograph" circuit 1), which I then built and tested. Following initial testing, Roy and myself worked together to tackle the challenges described above.
Circuit refinement
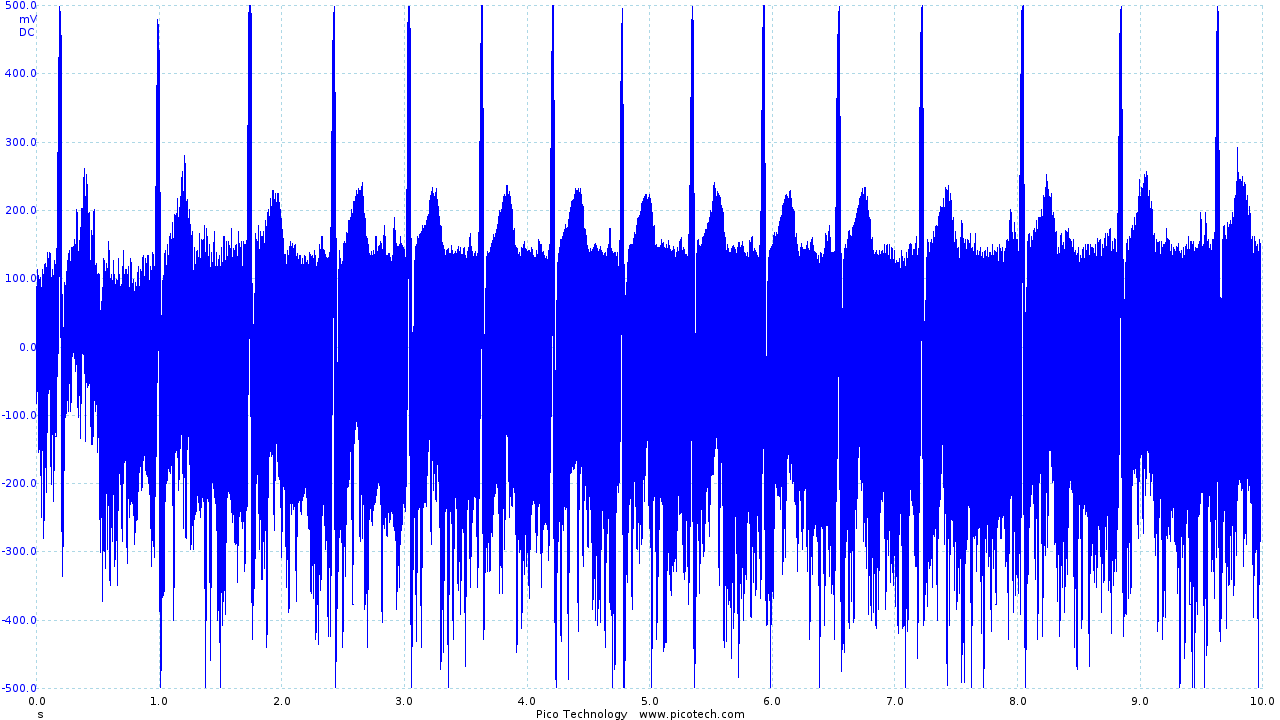
The initial circuit provided a recognizable ECG trace, shown below.
|
| Initial ECG circuit output before filtering |
Although recognizable, the trace obtained contains a large amount of noise as the first iteration of the circuit made little attempt to filter noise.
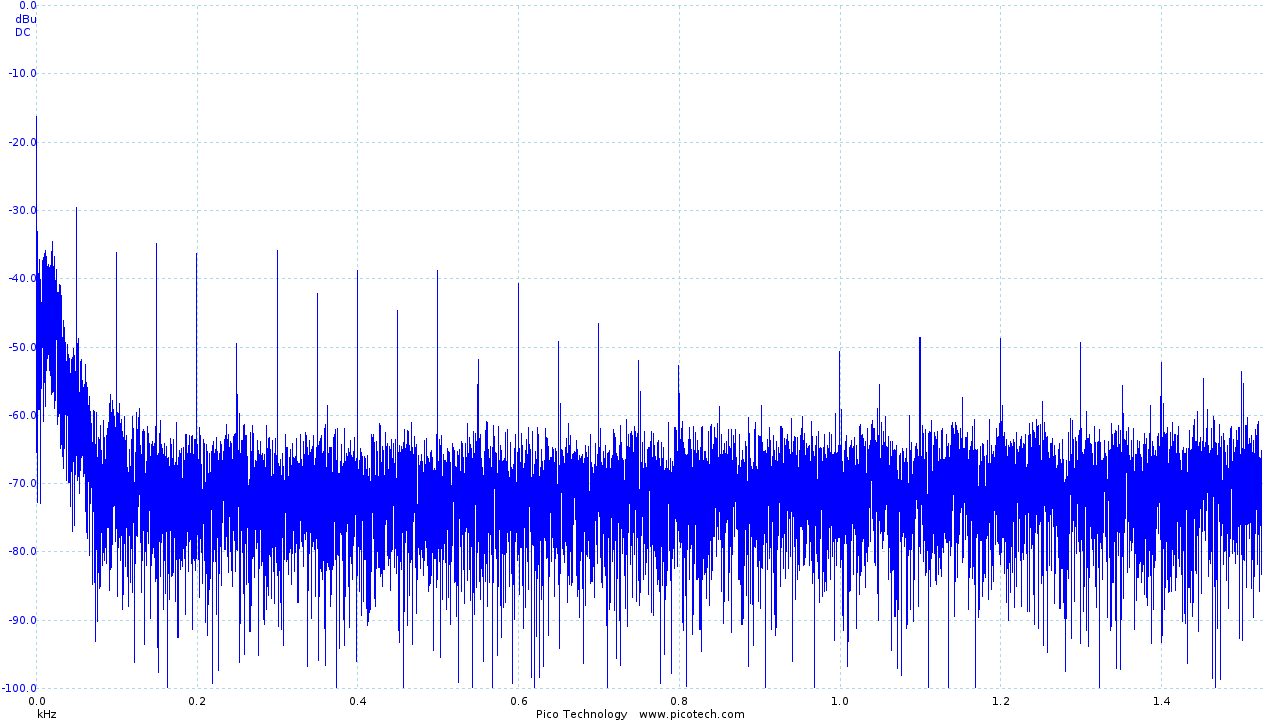
Using a Picoscope, Roy and I were able to identify the frequency of the noise introduced:
|
| Frequency analysis of the output of the initial ECG circuit |
We identified the troublesome frequencies as being 50Hz and its harmonics (100Hz, 200Hz, 400Hz, etc), which was likely introduced by our power supply and may not be a problem when the device is running on batteries. However, as these are beyond our desired signal frequency of 10Hz we were able to simply add a 2nd order low pass filter to remove the noise.
I was responsible for designing a second-order low pass filter, which was added after the final gain stage. The design took the form of a standard operational amplifier configuration (pictured below).

|
| A standard second order low pass filter |
The values chosen were as follows:
| R_1 | 7.5K |
| R_2 | 15K |
| C_1 | 1µF |
| C_2 | 1µF |
The cut-off frequency of the circuit above is calculated as follows:
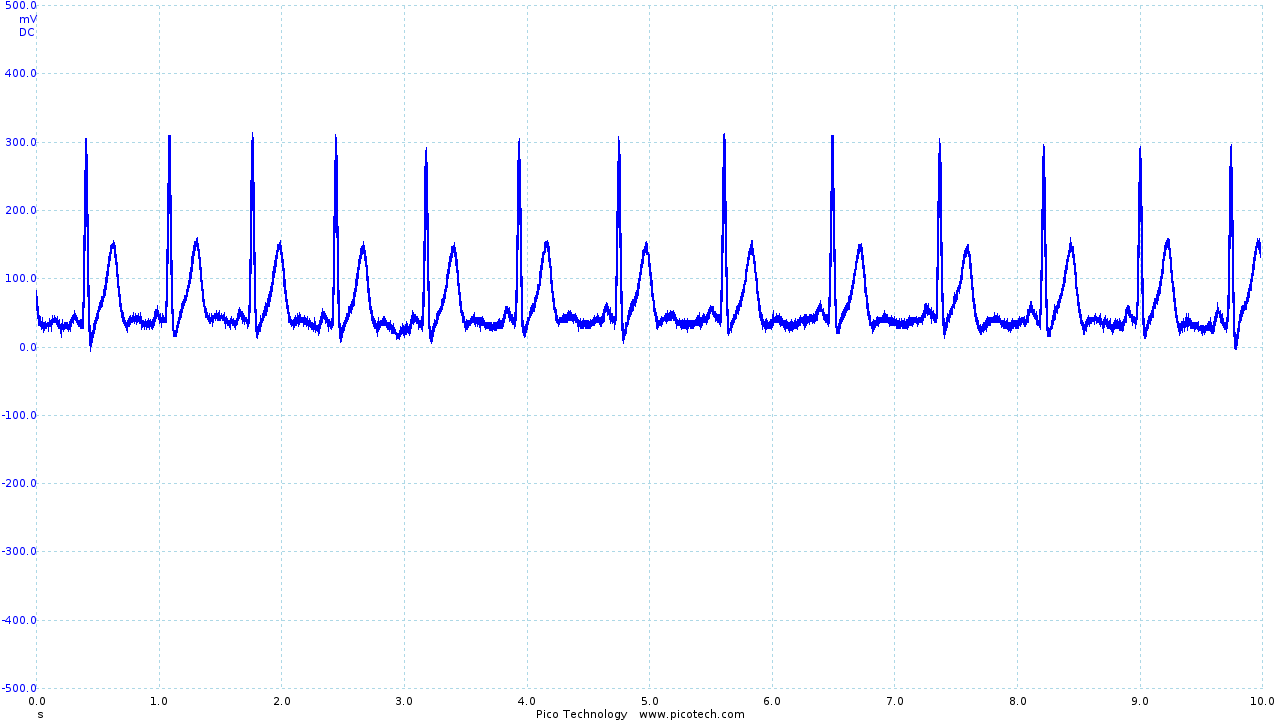
The addition of the low pass filter had a significant impact, resulting in the following output:
|
|
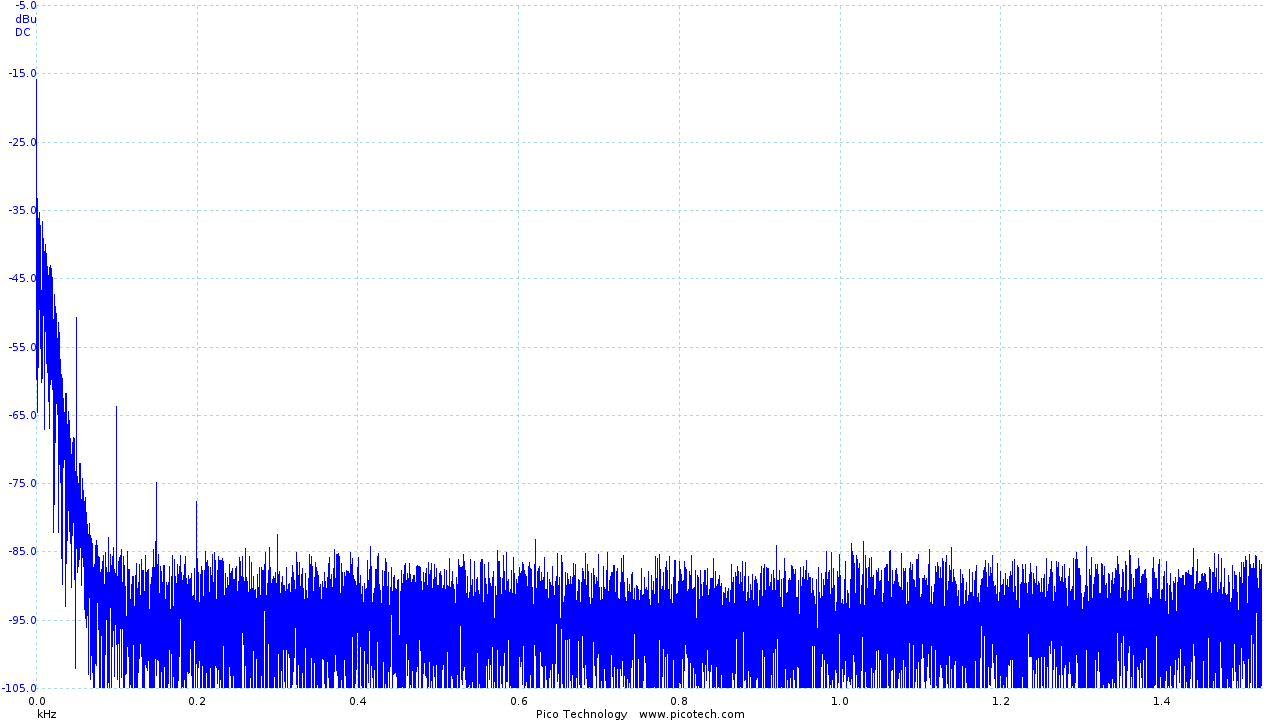
| ECG trace once the second order filter has been applied | Frequency analysis of the filtered output |
The frequency trace clearly shows our new 40dB/decade roll-off above the frequencies of interest and shows that the "noise floor" has moved from around 60dB to below 85dB, effectively removing the majority of noise present.
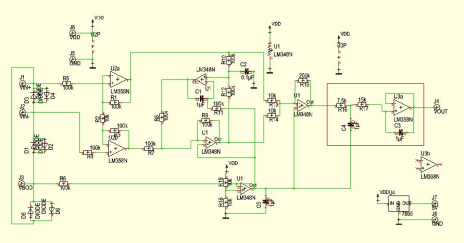
Final ECG Circuit Schematic
The full circuit schematic is printed below, with the filter that I added highlighted in red.
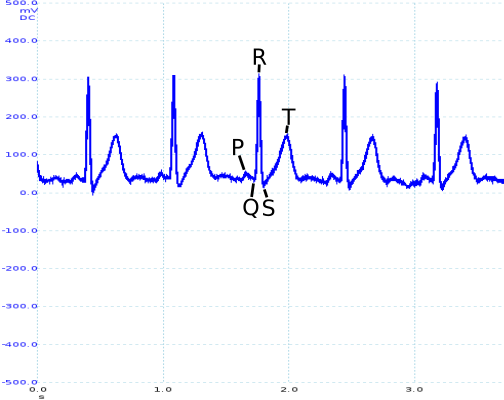
Circuit Evaluation
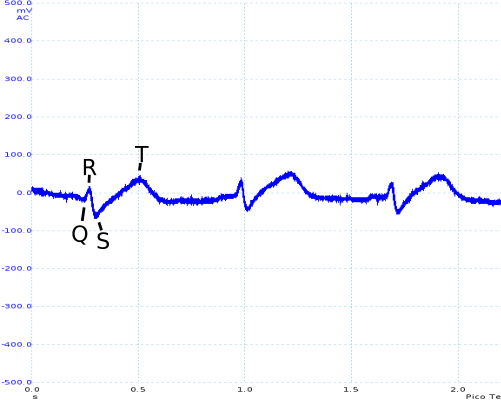
While it is difficult to quantitively evaluate how well the ECG circuit has performed (as we are generating an image rather than a quantitative value), P, Q, R, S and T sections are clearly identifiable on the trace obtained from the circuit, as can be seen in the waveform below:
The filter added to the initial design reduced the amplitude of noise at 50Hz by 20dB (as shown in the frequency response pictured above). Unfortunately, the filter was less successful as an anti-aliasing filter, as only 8dB had been removed by 25Hz. This is certainly an area that would need further looking into were the design to be taken any further.
Another issue that I identified later in the project was that the output of the circuit was biased at 4.5V. As the range of the ADC of the nRF51822 is 0 - 5V, this meant that we were not taking full advantage of the available resolution of the ADC, as we could have a maximum output swing of 1V.
While this turned out to not normally be an issue, we did occasionally find that the ADC was saturated at 5V, so a future revision of the circuit should include re-biasing the output to 2.5V.
It would also have been worth spending more time investigating "off the shelf" alternatives - while the circuit performance was acceptable, better results may have been obtained by using an IC such as the Analog Devices AD8232 L7.
Vest Electrodes
Up to this point, Roy and I had been testing using "Skintact" electrodes - an "off the shelf" product that is designed to achieve good electrical contact between the electrode and the skin. Unfortunately, the electrodes are single use and are also uncomfortable (particularly when removing them!).
As part of the project we wanted to integrate the ECG electrodes into the vest, removing the need for single-use electrodes and providing more comfort to the wearer. We also spent time investigating different placements of the electrodes, with the aim of reducing movement artifacts (caused by electrical activity in other muscles) and obtaining an acceptable input signal.
Electrode Placement
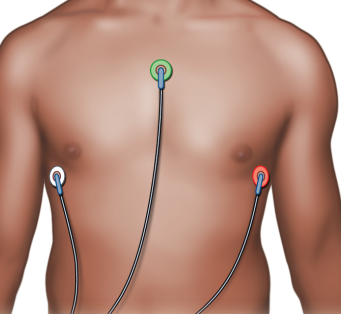
The generally accepted electrode placement for a 3 lead ECG has the -ve electrode on the right side of the chest, just below the shoulder bone, the ground electrode is placed on the left side of the chest, opposite the -ve electrode and the +ve electrode is placed in the 5th or 6th intercostal space on the left side of the chest. Unfortunately, very large movement artifacts are easily introduced, causing a complete loss of our desired signal.
|
|
|
| With little movement, a very clear trace is obtained (although in the image the +ve and -ve electrodes have been incorrectly connected, resulting in an inverted trace). | However, with movement, the trace becomes unintelligible. |
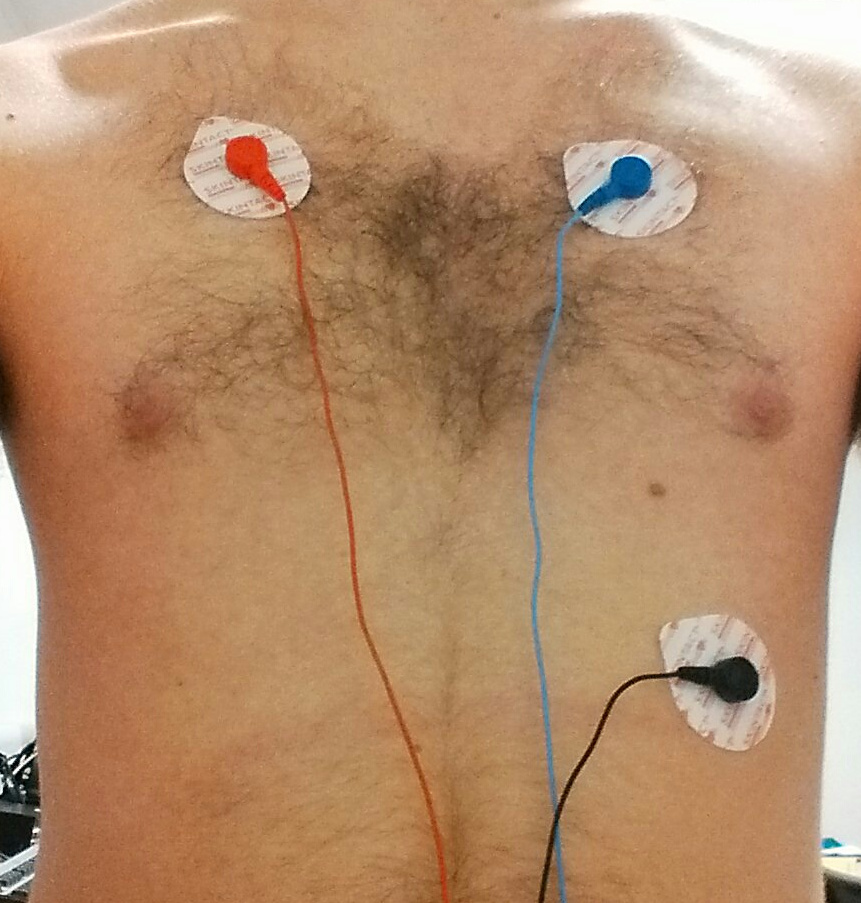
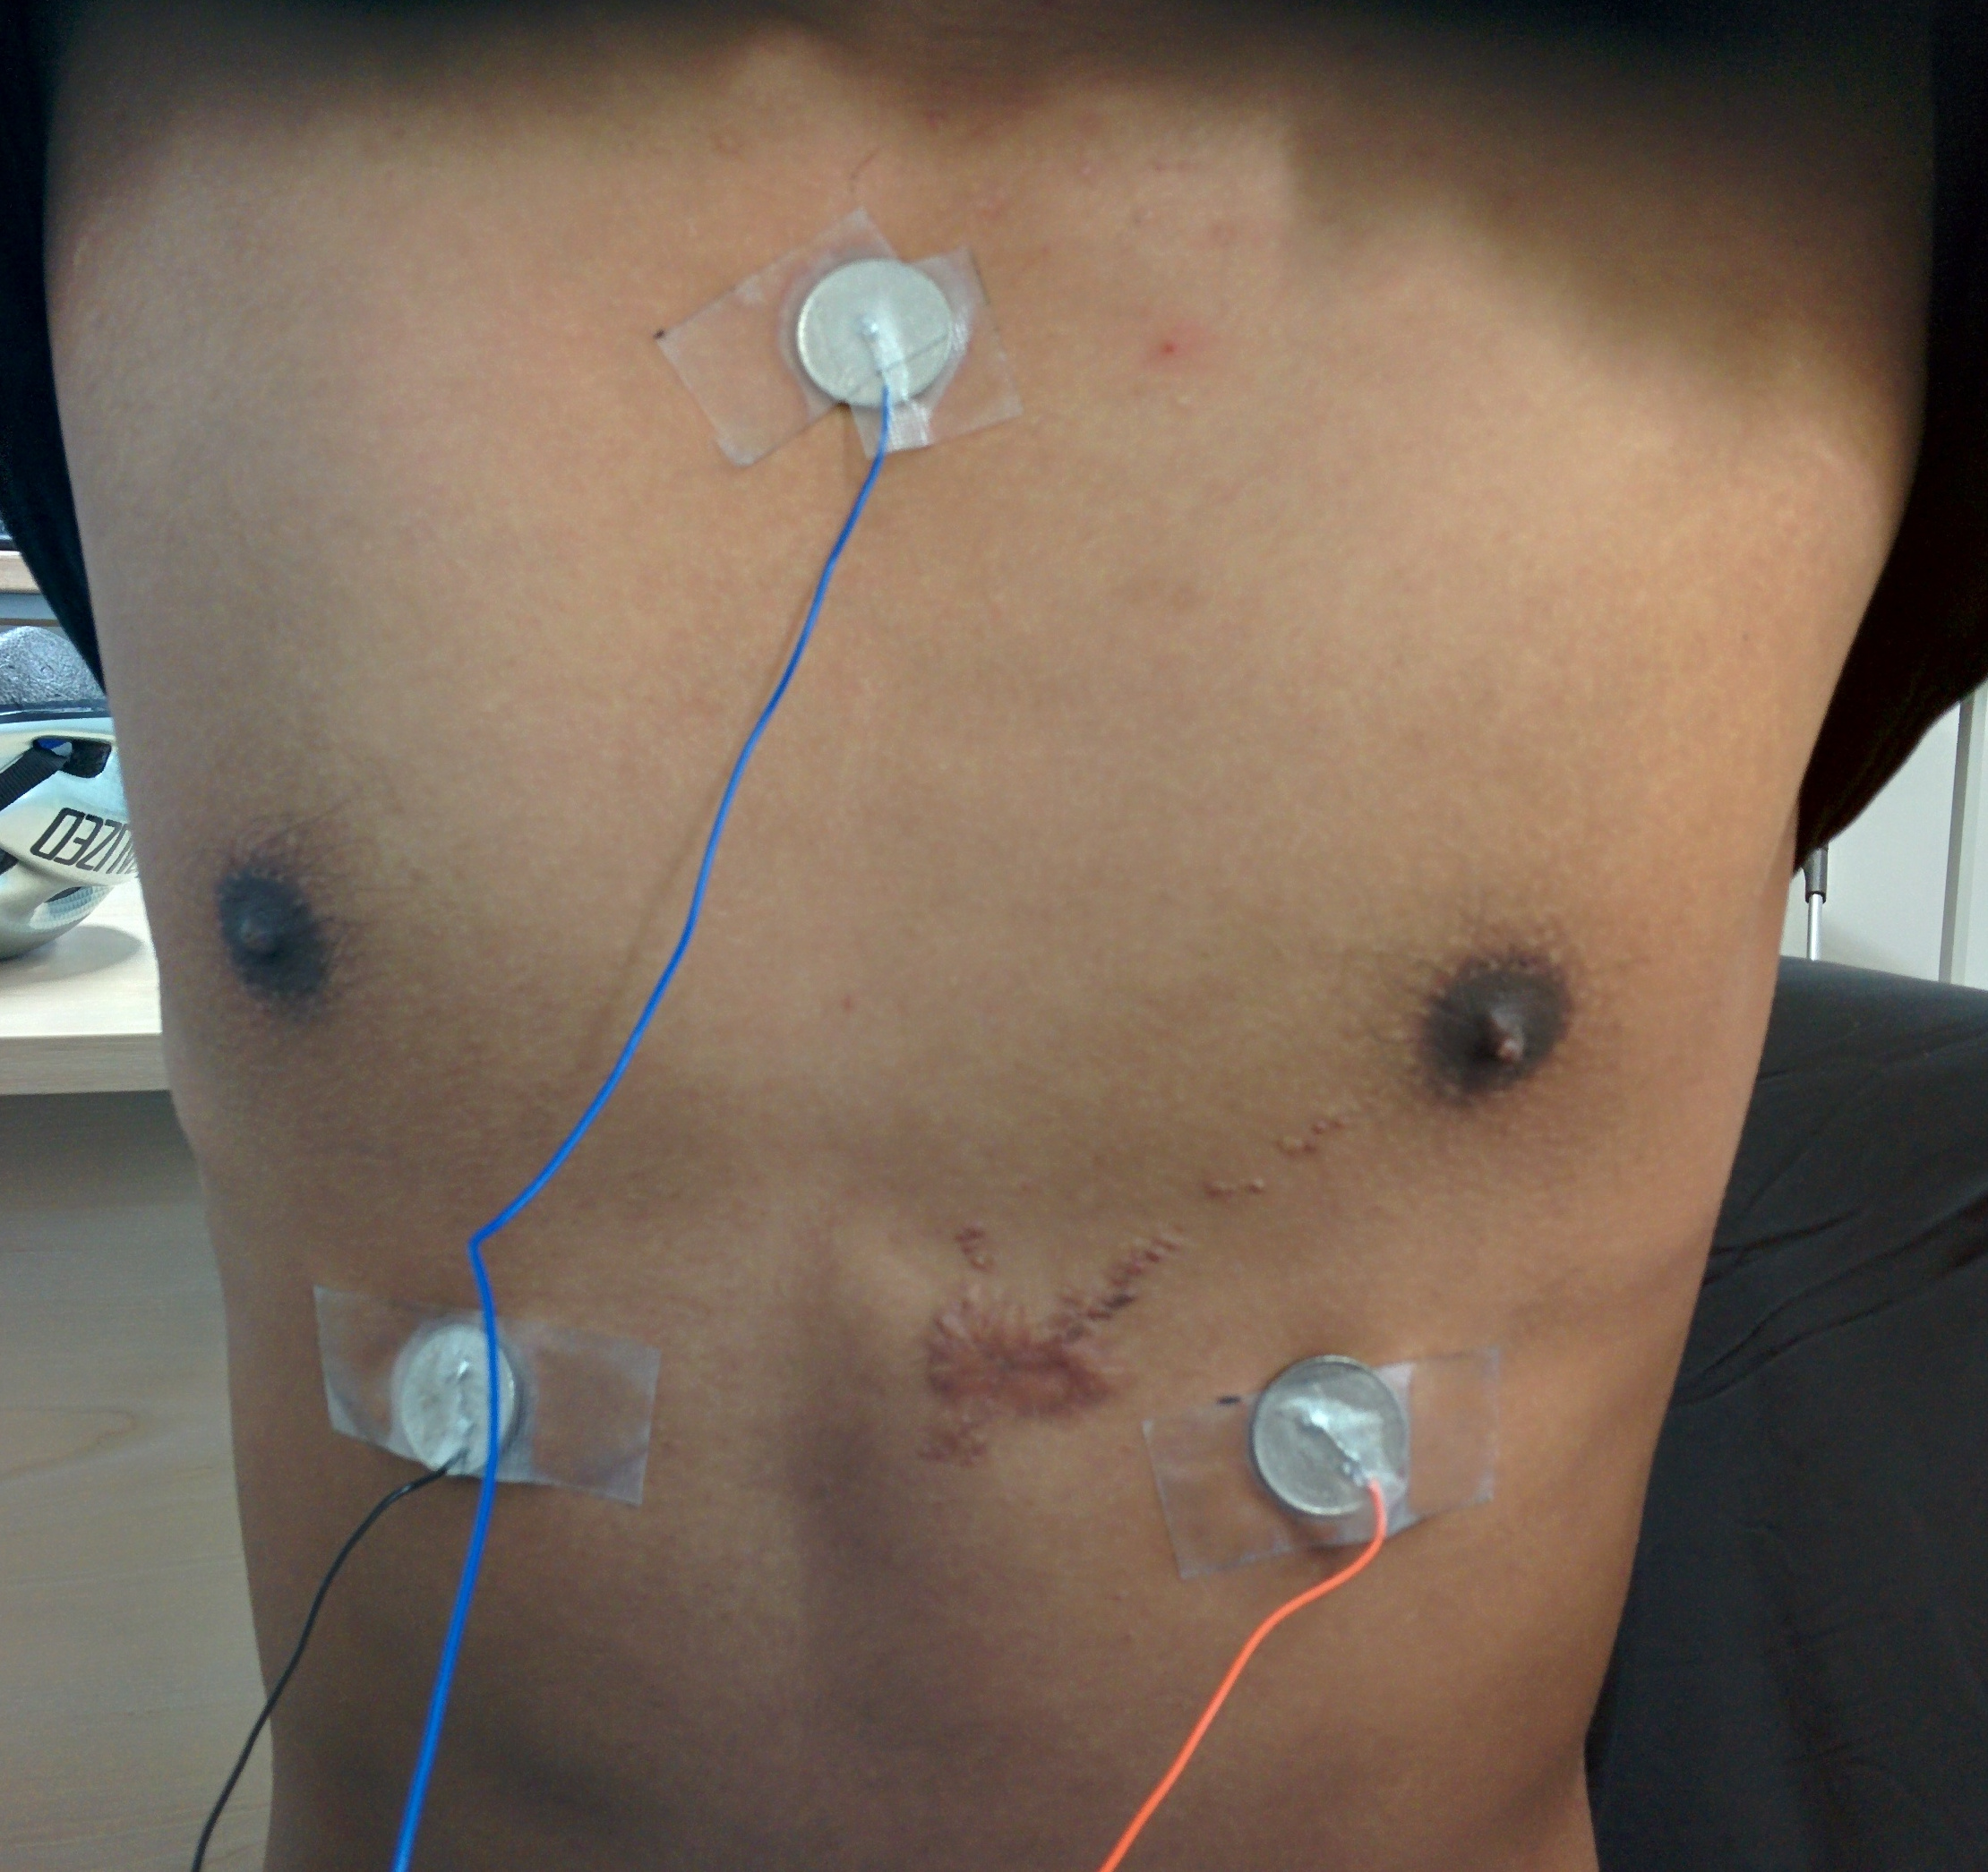
Roy and I investigated a number of different electrode placements, but after a little research, I came across an alternative electrode configuration which is recommended for use in exercise physiology (which involves large amounts of movement during tests). The configuration, introduced in "Exercise Physiology: Nutrition, Energy, and Human Performance" 2, has the ground electrode on the sternum with the -ve and +ve electrodes in the 5th intercostal space on each side of the chest.
|
| From "Exercise Physiology: Nutrition, Energy, and Human Performance" 2 |
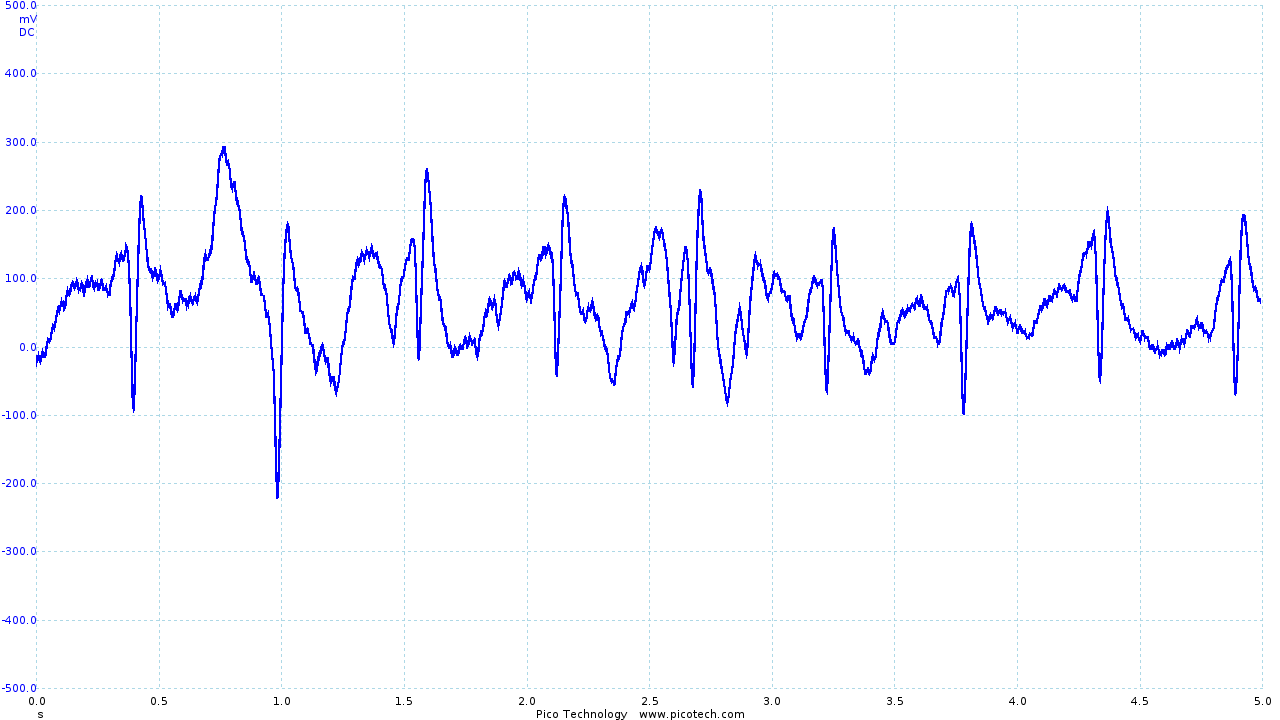
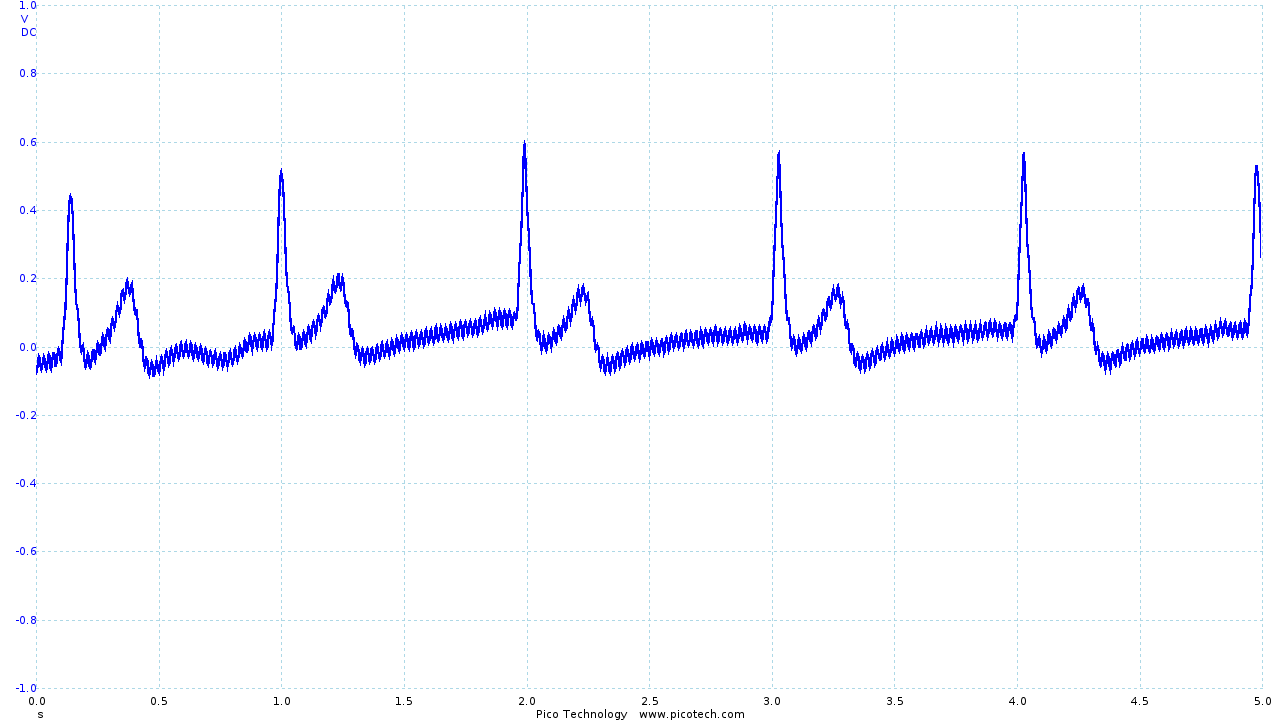
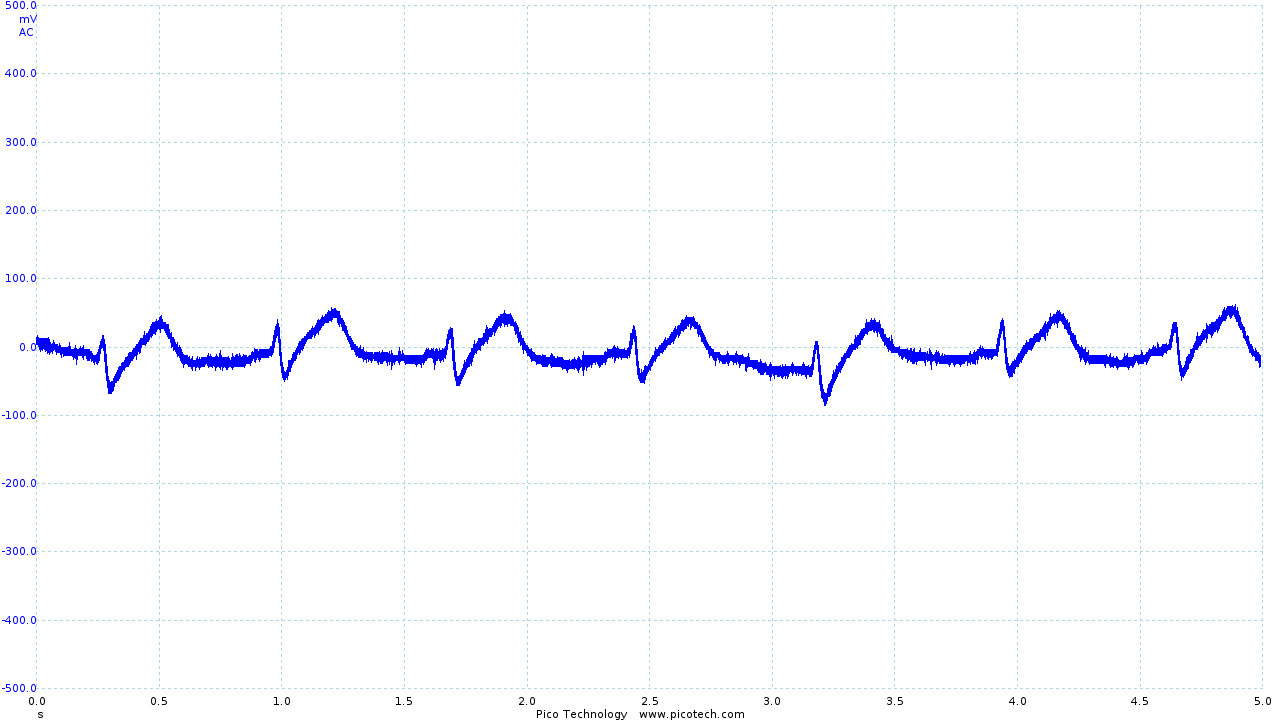
This placement produces a satisfactory trace, pictured below, which is less susceptible to movement artifacts.
|
|
This positioning is also suggested by Hakyung Cho and Joo Hyeon Lee in their paper "A Study on the Optimal Positions of ECG Electrodes in a Garment for the Design of ECG-Monitoring Clothing for Male" (sic) 3.
When integrating the electrodes into the shirt (discussed in more detail below), we found that moving the ground electrode to the right shoulder produced a very similar trace but provided better contact with the skin.
Electrode design
Having decided on a suitable placement for the electrodes, I then spent a small amount of time investigating different materials that could be used for the electrodes. A number of papers (45 to list two) have been published on this subject in recent years, and provide interesting reading.
Unfortunately, the lead time and expense of such materials meant that it was not practical to use such materials in the project. Instead, Roy and I attempted a few different solutions.
One option that we considered was using parts of the Skintact electrodes, as pictured below:
Unfortunately, we found that the sponge material used in the electrodes became very fragile when it dried out making it unsuitable for longer term use.
I decided to investigate using conductive copper tape. This was cut into small sections of approximately 15mm and stuck to the inside of the vest. While this was somewhat successful, I found that performance was improved by adding a slight bulge to the electrode. By wrapping the tape round a metal stud the contact area is pushed into the skin a little more, improving the contact surface.
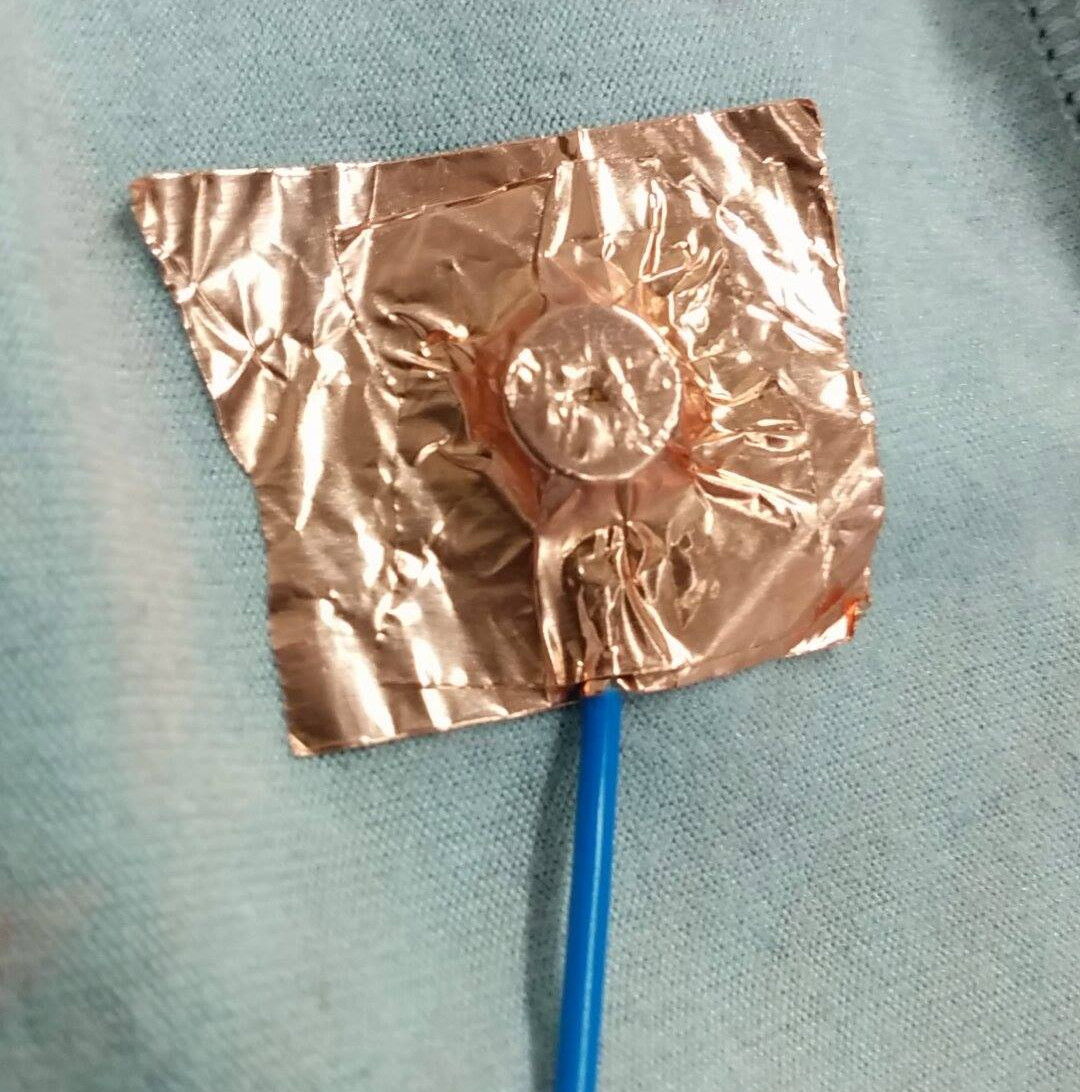
|
| An example of a copper tape electrode |
While the copper tape electrodes performed reasonably well while the wearer was stationary, we once again found that movement caused the signal to be lost. Roy and I investigated using an electrode gel to improve contact between the skin and the electrode, and I suggested sewing small patches of cloth over the electrodes to keep the gel in place.
We found that the use of an electrode gel significantly reduced the noise seen when using our copper tape electrodes, even during movement, and the cloth patches did a reasonable job of keeping the gel in place.
Evaluation
The requirement to use a conductive gel is disappointing and makes putting the vest on difficult (as care must be taken to avoid spreading the gel off the electrodes). While not particularly uncomfortable, the design would be significantly improved if this requirement could be removed. Given the amount of current research into conductive materials and wearable technology, it is likely that this could be overcome with a little more time and research.
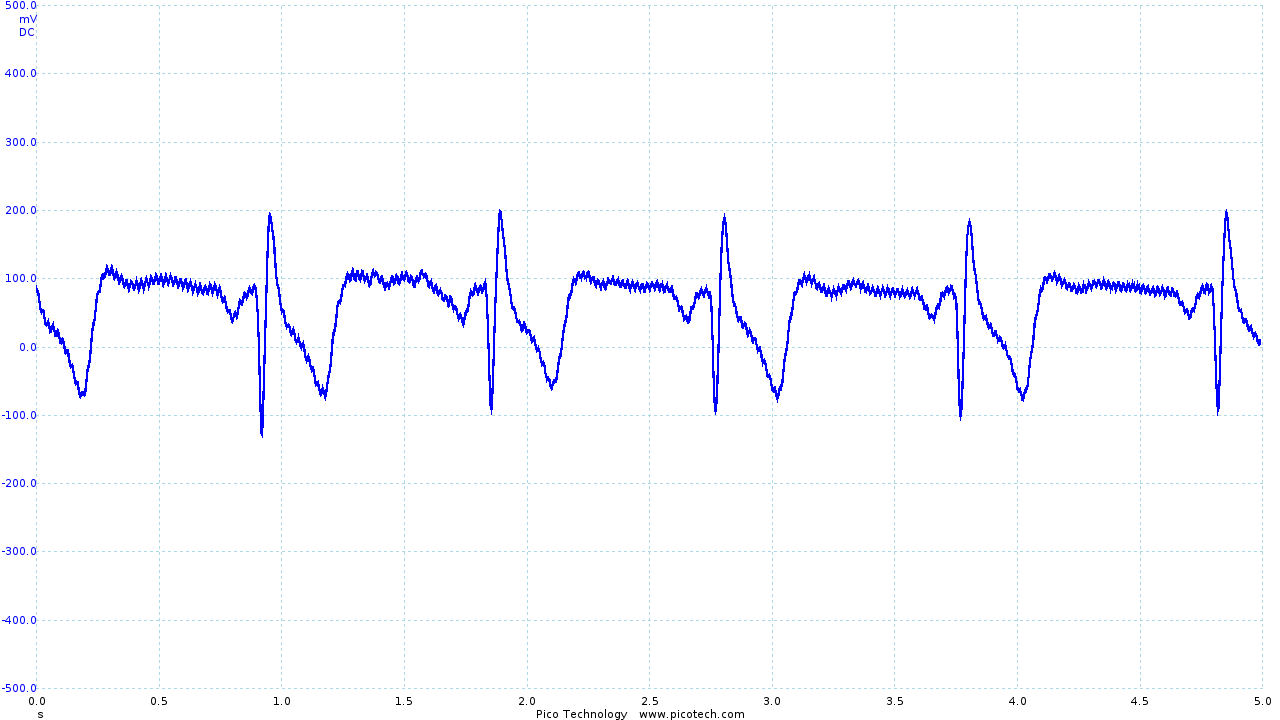
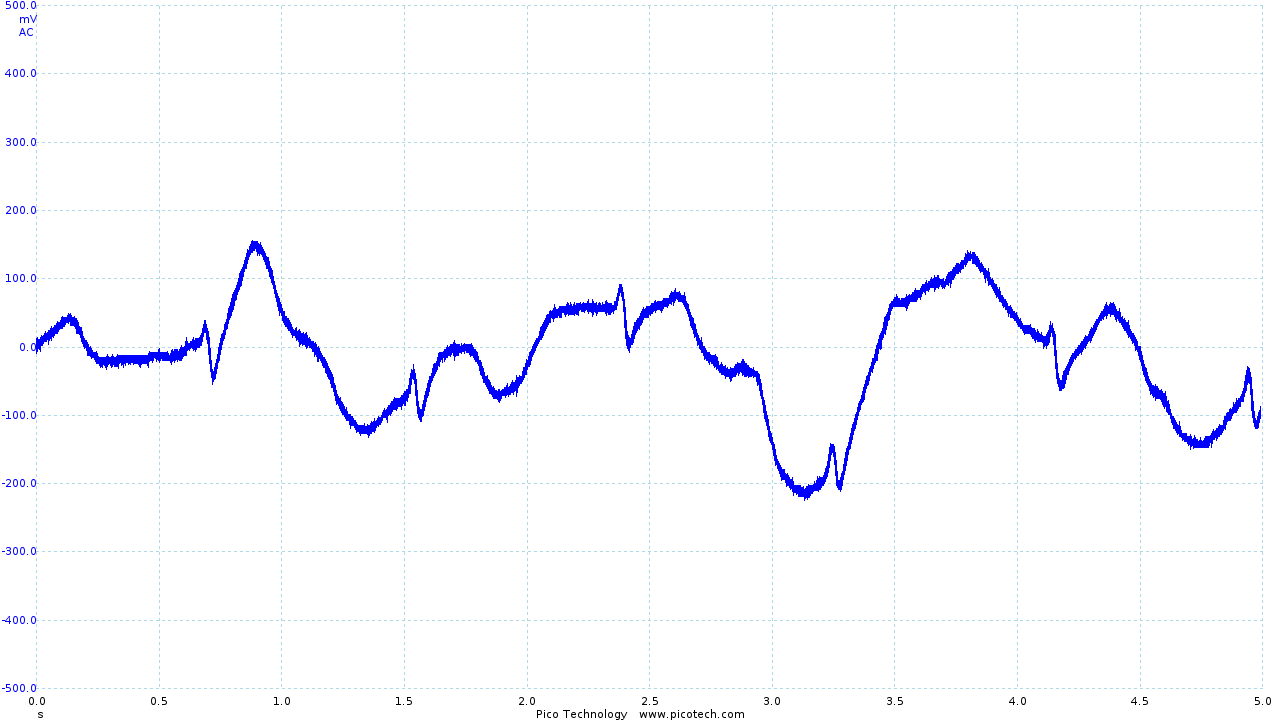
The output obtained from the vest leaves much to be desired.
|
|
|
|
| The trace obtained using Skintact electrodes | The final output from the vest and ECG circuit | Movement artifacts seen in the final output |
The R and S sections of the trace are quite clearly visible (although small), with the Q section of the trace occasionally obtained. However, the T section of the trace is significantly distorted, and the P section is rarely seen.
As seen above, movement is still an issue. However, even during movement R and S sections of the ECG trace can be identified. While it has not been possible as part of the project, I would like to investigate in the future whether digital signal processing (particularly in combination with other sensors, such as accelerometers) could be used to recover a reasonable ECG trace.
Thermometer Circuit
A reasonably late addition to the vest was adding a thermistor and incorporating a potential divider circuit in the belt pack so that the vest could measure the body temperature of the wearer.
I designed the (very simple) circuit for the sensor, which consisted of a potential divider fed into an op-amp. The op-amp provided a suitably low output impedance, ensuring that the measurement wasn't affected by current flowing into the ADC of the nRF51822.
The thermistor was sewn into the vest under the right armpit. This is one of the few locations on the body where skin temperature gives a good indication of core body temperature.
The voltage produced by the potential divider was then converted into a temperature by software running on the nRF51822, as discussed in the following section.
Evaluation
The thermometer circuit was very simple and provided reasonable performance. Further testing and validation of the performance of the sensor would be required to give a more thorough evaluation of the sensor, as the sensor was only tested at room temperature and body temperature due to time constraints.
mbed Programming
I was solely responsible for writing the software that ran on the nRF51822.
For the most part, the software is very simple. As the mbed libraries contain all the code required for the setup and use of the ADC and Bluetooth chip, all that was required was to link the two together and perform simple arithmetic on the temperature sensor readings to convert the obtained voltage to degrees celsius.
ECG Sampling
In order to show high-frequency components of the ECG trace, one must sample the
ECG output as frequently as possible. Sampling was achieved by setting up a
Ticker, which interrupts the CPU at a defined interval and causes a reading
from the ADC to be taken. The value is then transmitted using Bluetooth Low
Energy.
Due to the overhead of sampling the analog signal and transmitting the new value, I found that the minimum practical interval for sampling was 20ms. This gives a sampling frequency of 50Hz, which is sufficient for sampling signals of up to 25Hz.
Temperature Sampling and Calculation
For the temperature measurement obtained to be useful, I needed to convert the voltage obtained from the thermistor into degrees celsius. The temperature (in degrees Kelvin) of a thermistor can be approximated using the extended "Steinhart and Hart" formula:
where , , and are constants specific to the thermistor. These values were obtained from the thermistor's datasheet 6.
Having calculated , it was then simply a case of subtracting 273 to convert to degrees celsius.
As body temperature changes relatively infrequently, the temperature was only sampled once every second. While a smaller interval could have been used, this would have increased the minimum sampling interval for the ECG sensor with little gain.
Evaluation
The software was functional, ensuring that values obtained from the two sensors were correctly sampled and transmitted. However, better sampling rates may have been achieved by storing a number of samples and transmitting them in chunks (reducing the amount of time spent transmitting).
If more time were available, it would be worth spending a significant amount of time investigating more efficient ways of transmitting the data obtained, as this would appear to be the major bottleneck in the system. As an example, one might consider gathering a seconds worth of data, then transmitting all the data in one go.
Packaging
I was responsible for integrating the electrodes and thermistor into the compression shirt, and building a belt pack for the electronics.
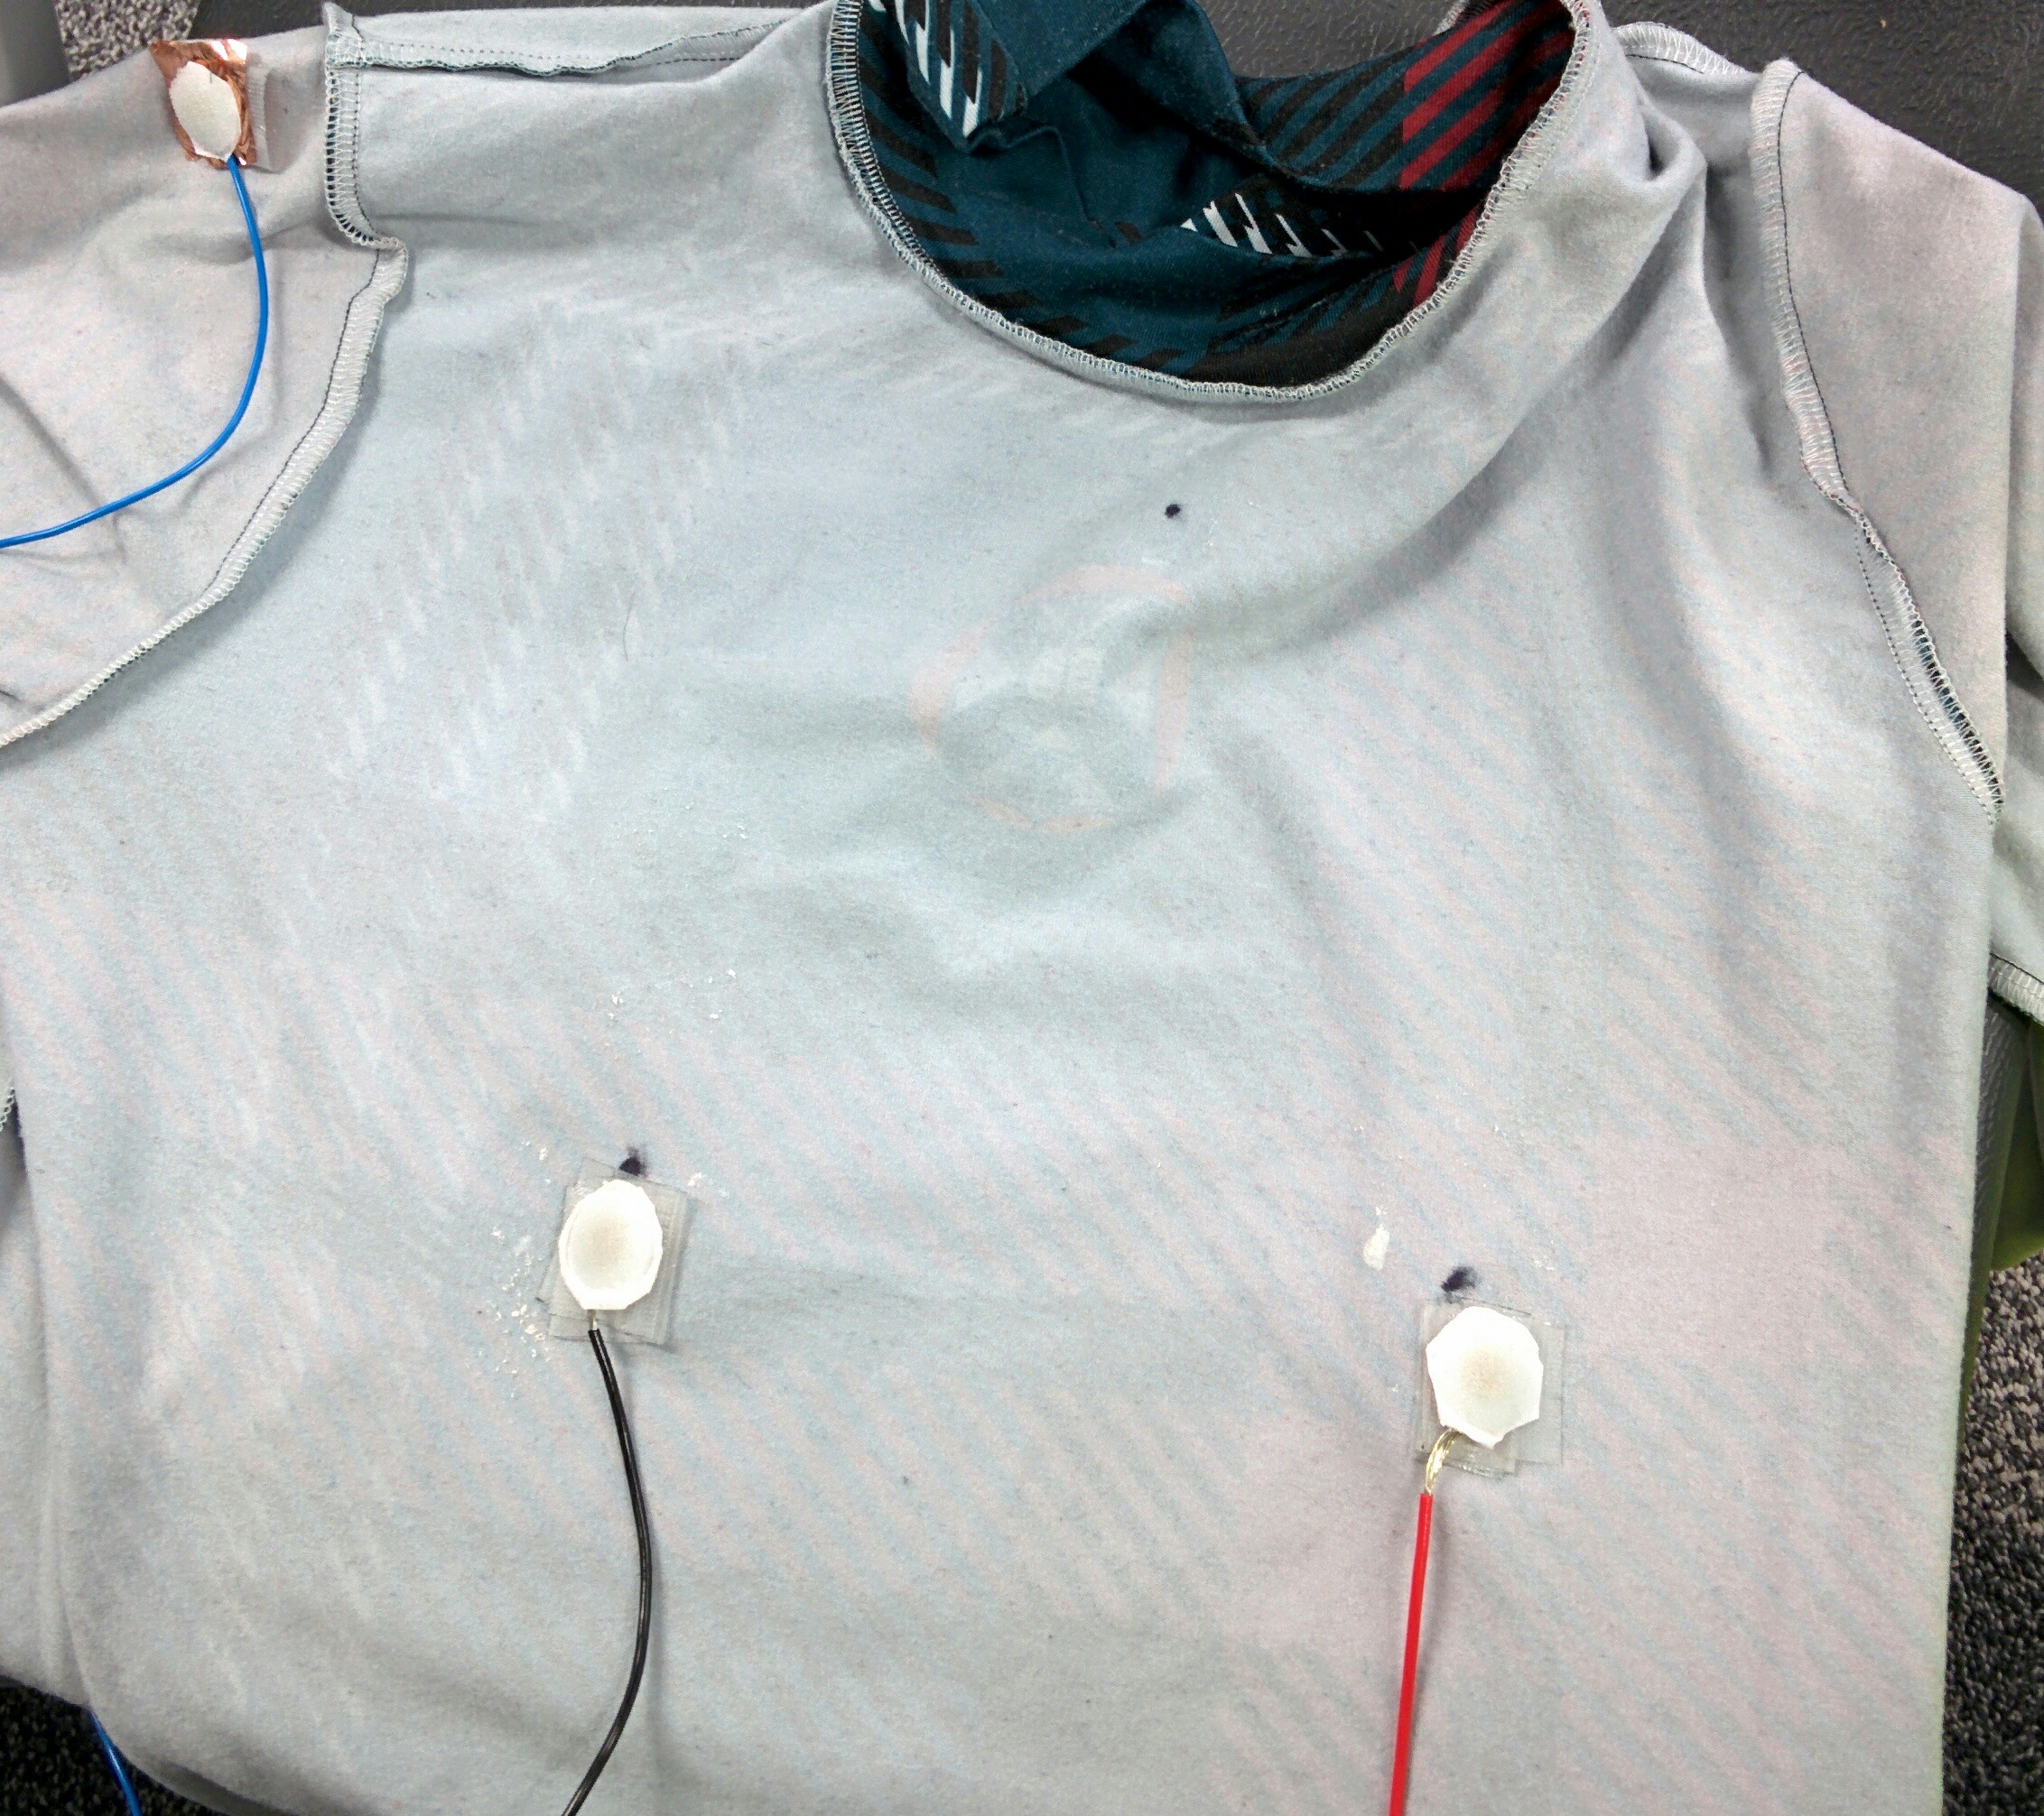
I sew the ECG electrodes, thermistor and stranded cable into the inside of a compression shirt. This ensured that the sensors remained in the same place, and the cabling was kept tidy.
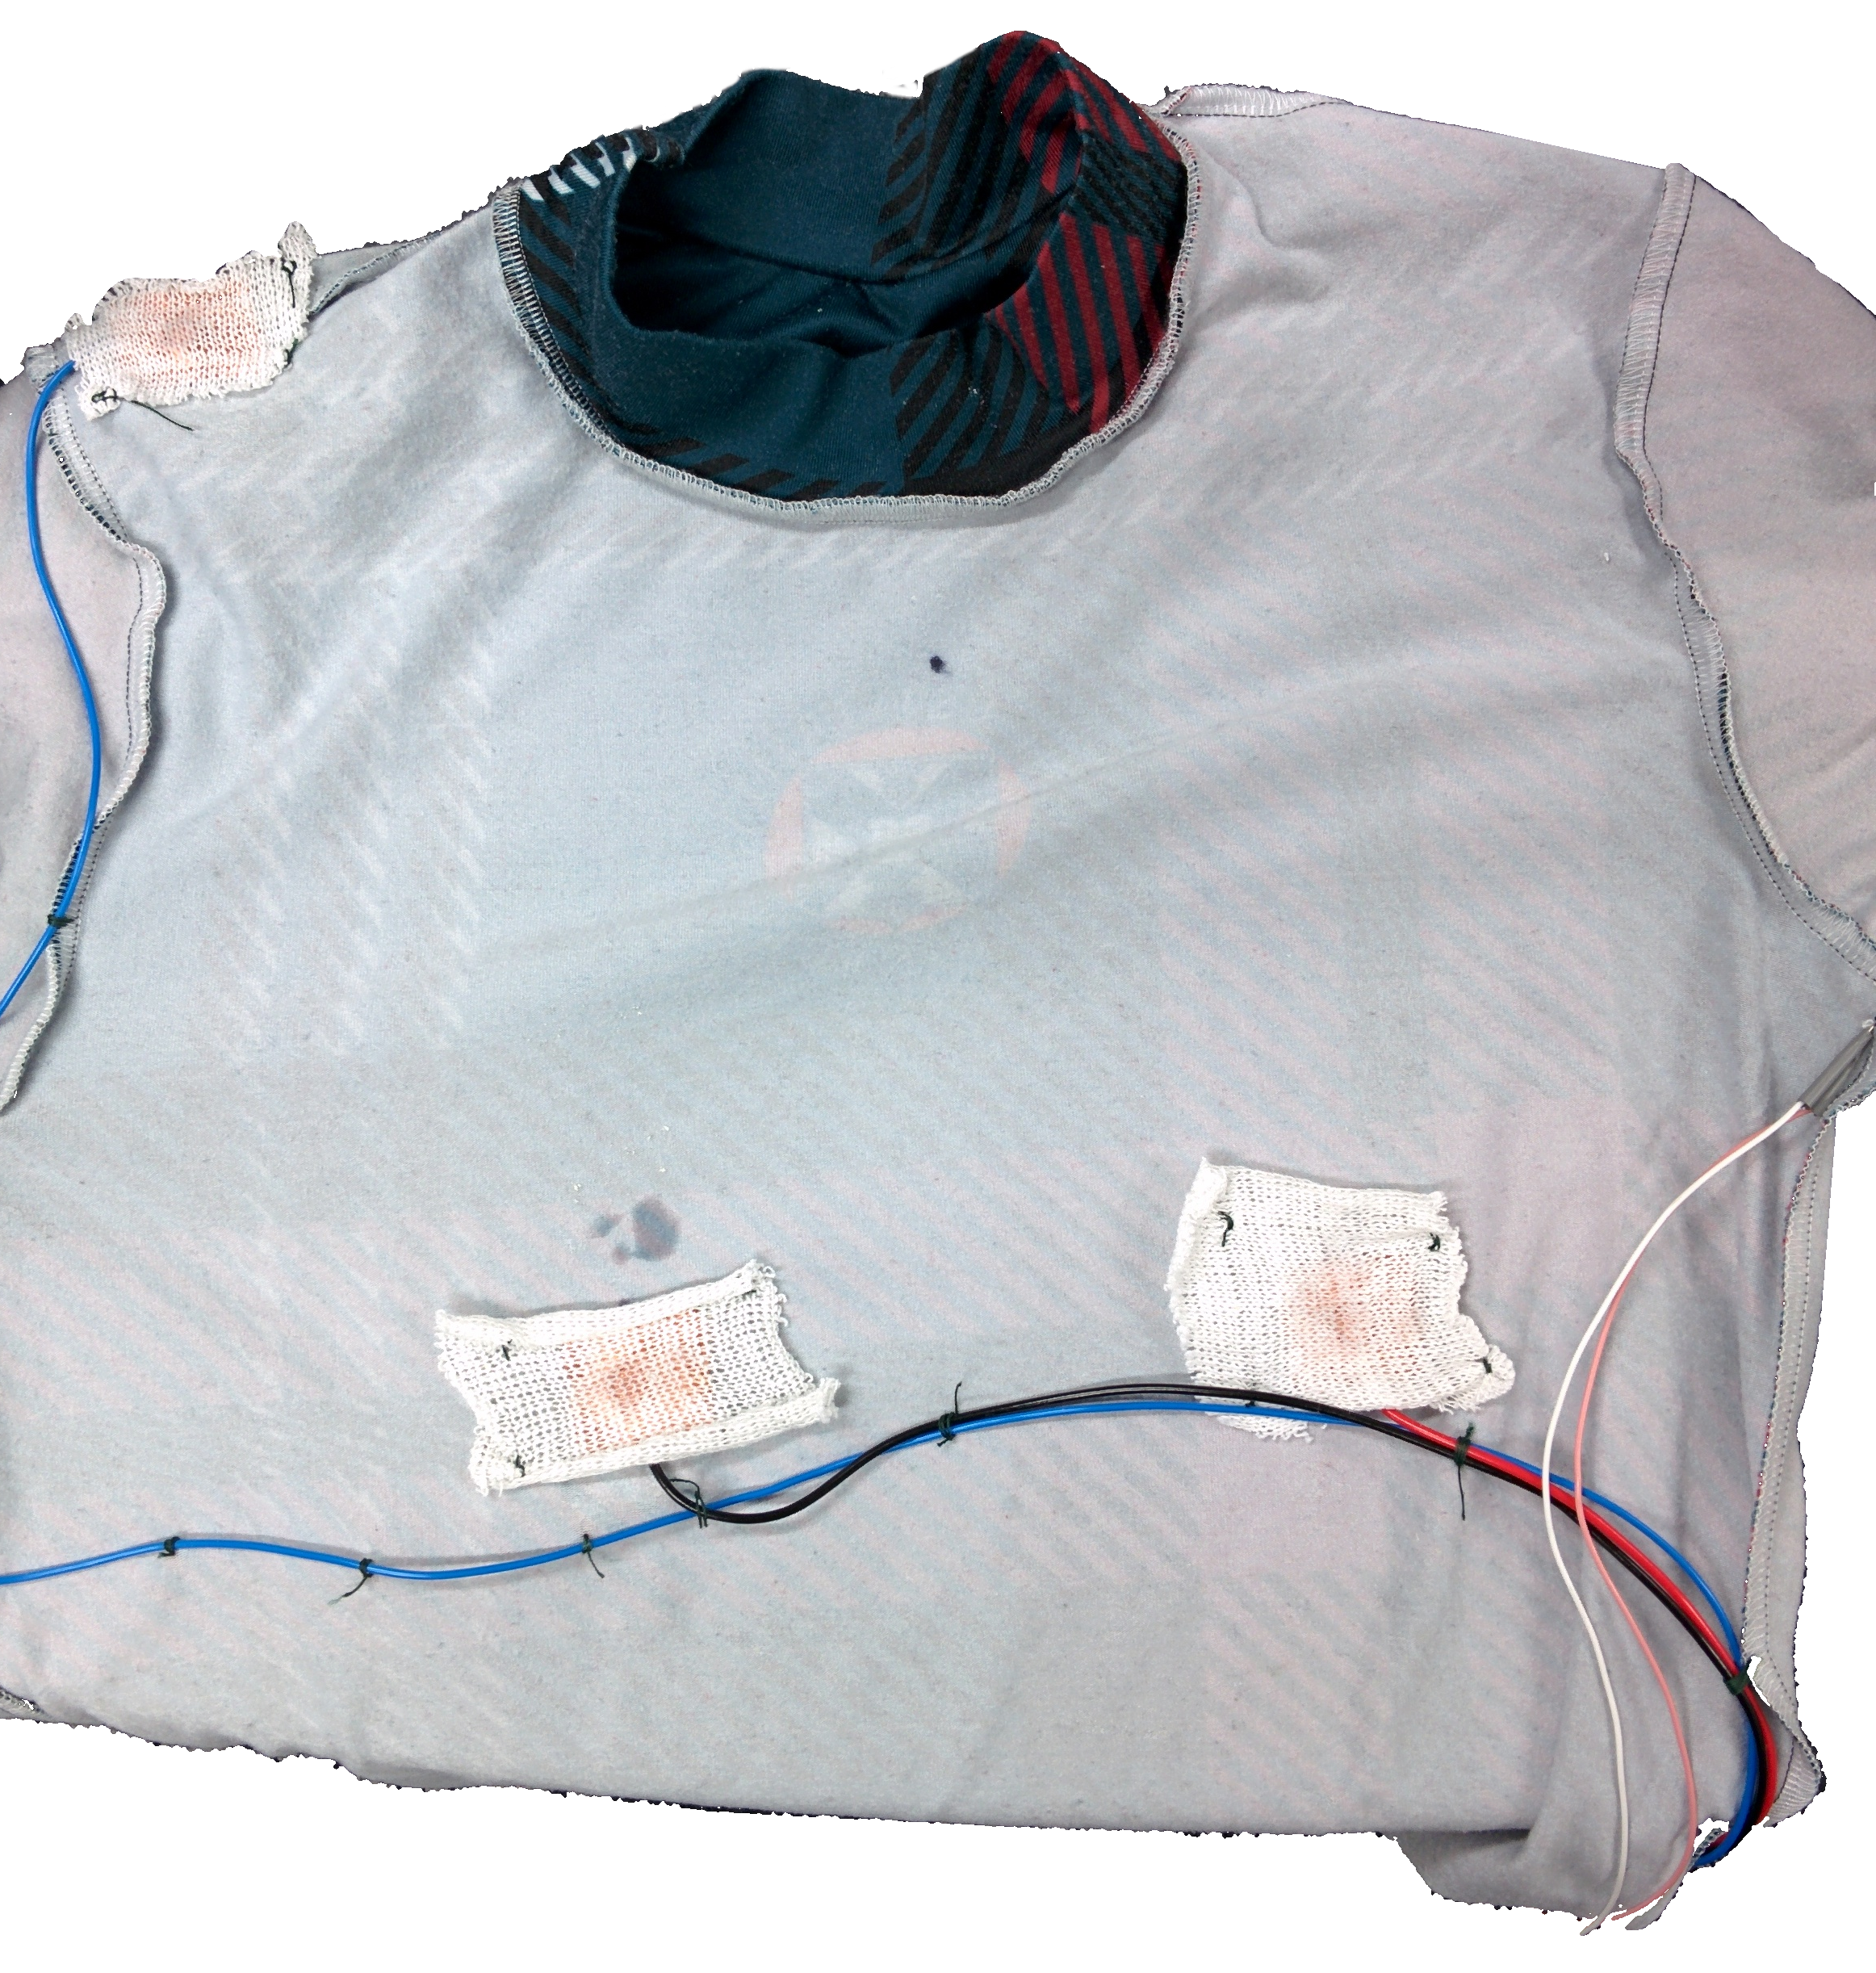
|
| The inside of the compression shirt |
The 5 cables coming out of the shirt were then loomed together using AT7 PVC tape, and connected to a male 9 pin D-Type connector. Using a D-type connector allows easy disconnection of the shirt from the belt pack, which allows the shirt to be washed.
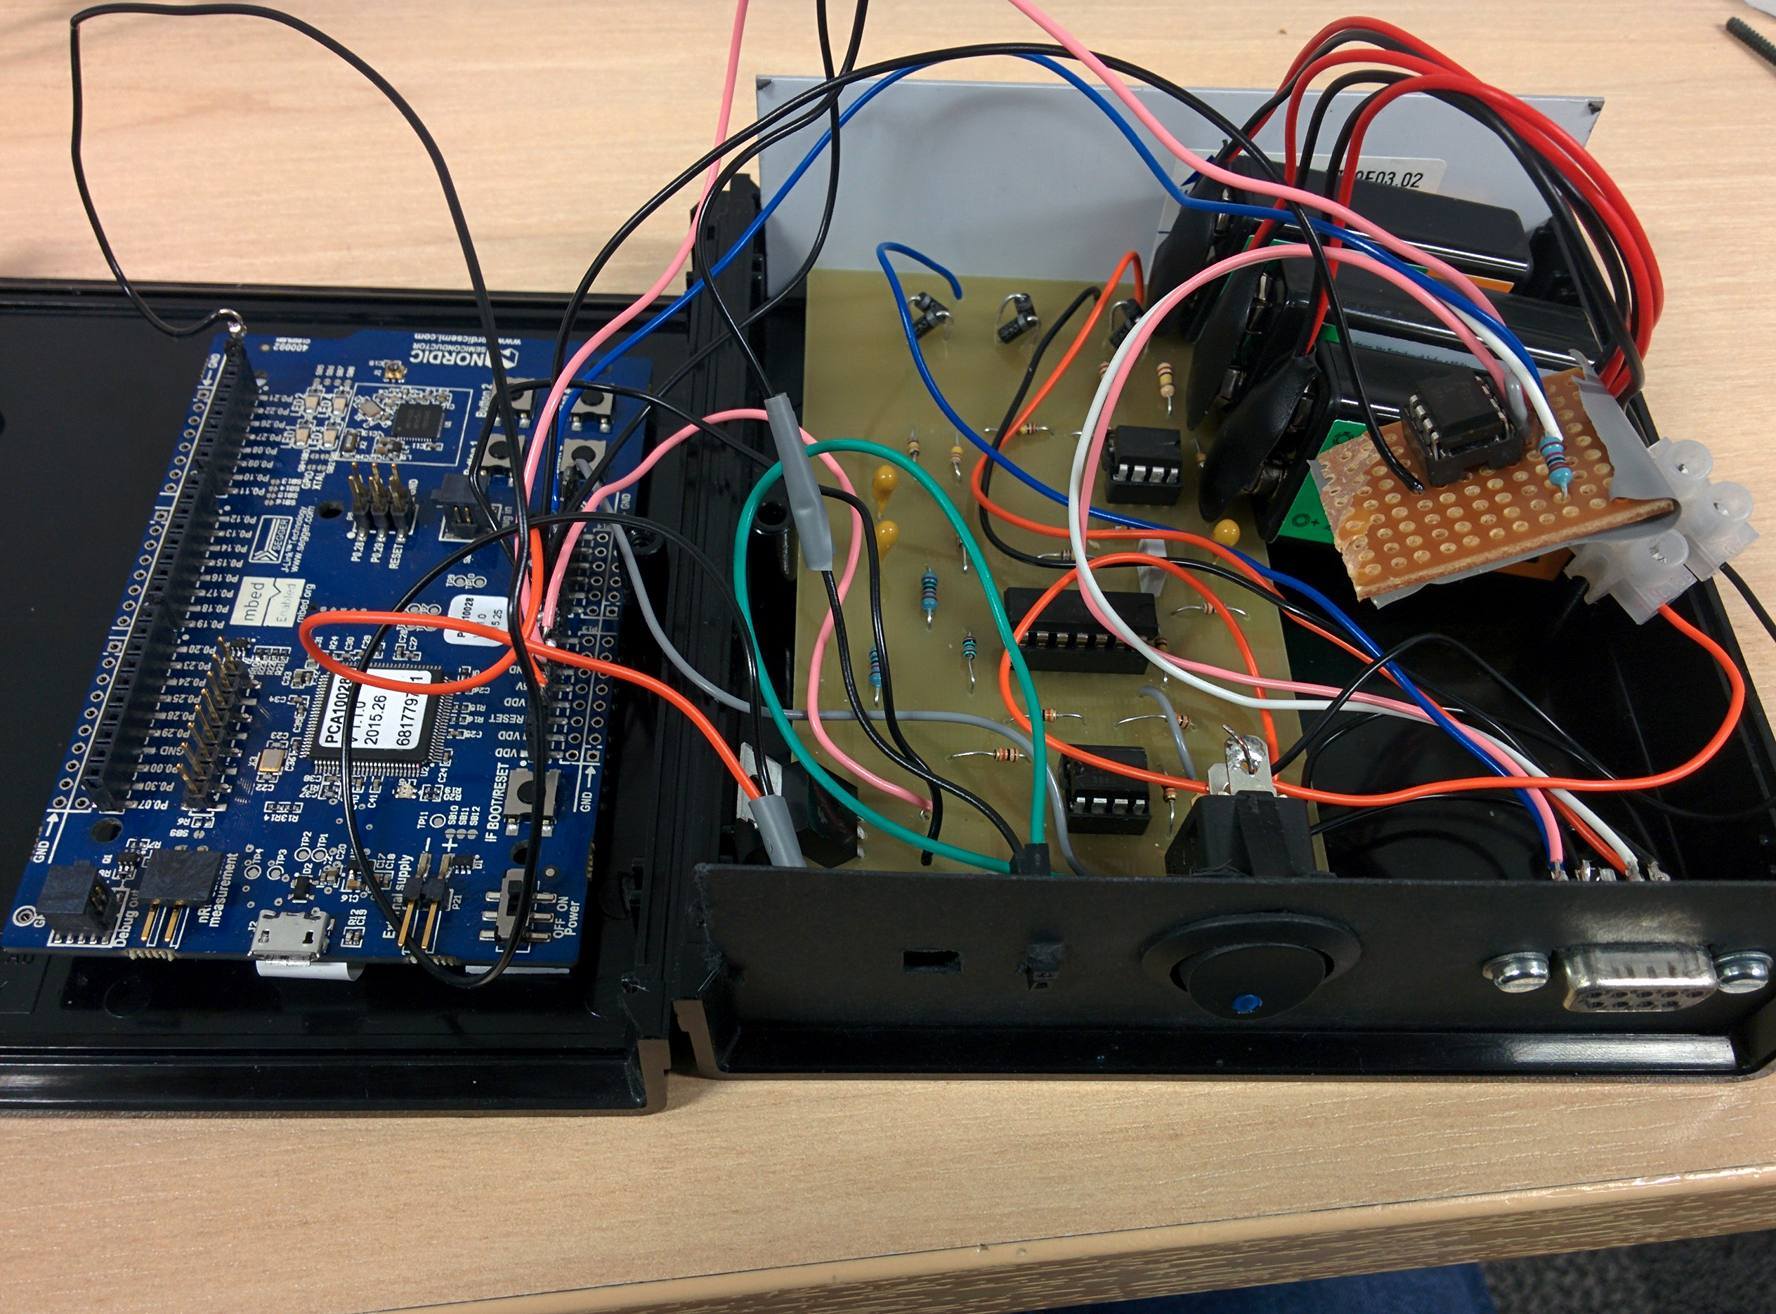
|
| The belt pack, opened to show components |
The ECG and thermometer circuits, together with 3 x 9V batteries and the nRF51-DK were placed into a black plastic case. On the front of the case, I added a power switch, indicator LED, and a female 9 pin D-Type connector. I also added 2 female headers which were connected to the output of the ECG circuit to allow the output to be recorded easily once the case has been closed for the purposes of evaluation and composing the group's reports.
Evaluation
Unfortunately, the belt pack was very large. This is largely due to the size of the nRF51-DK, and the ECG circuit PCB. This made it cumbersome to carry around, and would need to be improved if more time were available.
The compression shirt successfully held the electrodes and temperature sensor in the correct places, and is not uncomfortable to wear. Use of thinner stranded cable would have reduced the small amount of discomfort that results from the routing of the sensor and electrode cables. With more time, the cables could be better integrated into the shirt, perhaps by sewing material over the whole length of the cable.
Website
I was also responsible for the design and implementation of the group website.
The website has two primary functions - as well as hosting the group's reports, the website also displays the data obtained from the health monitoring vest.
The website has been built as a "mock-up" of what a production site may look like, with the homepage advertising the product and a dashboard for users to view data obtained from the vest.
Users would use the "Login" button in the top left to access their own data. Since the API does not yet handle authentication, any email address and password may be used to login at this time. Unfortunately, the "historic" BPM graph is also only a proof of concept, as the data has not been presented by the API.
Taking into account the web hosting facilities that were made available, I decided it would be best to create a "static" website (that is, one where pages are not generated by the server when they are requested) and make use of javascript to pull data from the API server and Firebase.
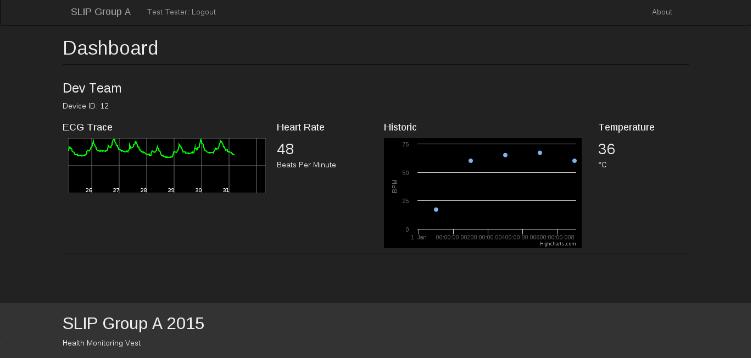
|
| A screenshot of the website dashboard |
Backbone
In order to increase the maintainability of the site, I decided to use the Backbone.JS L1 library which provides base classes for models, collections, and views. This allows a developer to easily split a potentially fairly large amount of javascript into discrete components.
On top of Backbone.JS, I also used the Marionette library L2 which removes a large amount of "boilerplate" code that is often associated with Backbone applications.
Gulp
A number of different tools have been used to make developing the website easier. JavaScript code has been written in CoffeeScript L3, as this makes files easier to read and provides a number of useful features such as classes (which aren't otherwise available in JavaScript). Stylesheets have been written using SCSS L4, which allows classes to be nested and also provides a number of useful helper functions.
Both of these tools require that code is compiled before it can be served to the user. Add to this a number of libraries that have made front-end development easier (such as the Bootstrap CSS library L5), and it is clear that the build process is non-trivial.
Thankfully, a number of tools exist to automate the build process. I decided to use Gulp L6 - a relatively new tool designed for automating build processes that I hadn't used before - as this provided a good opportunity to learn how to use it.
Gulp is configured using a gulpfile, which defines a number of task "streams".
A stream is created by selecting source files (such as CoffeeScript files), then
run through a plugin that performs some manipulation on the stream (such as
a CoffeeScript compiler), and output to target - either a single file or a
directory.
The final gulpfile is available in the website section of the source code,
and defines tasks for compiling CoffeeScript, SCSS, handlebars templates, and
markdown, as well as tasks for moving dependencies into accessible locations.
Evaluation
The website is currently fairly simple, but successfully shows the data obtained from the vest. It has been written in such a way that adding additional sensors and features would be relatively simple.
References
1: Homemade Electrocardiograph, Jason Nguyen, http://www.eng.utah.edu/~jnguyen/ecg/long_story_3.html, Accessed 2015-10-12
2: Exercise Physiology: Nutrition, Energy, and Human Performance, William D. McArdle, Frank I. Katch, Victor L. Katch, PP327
3: A Study on the Optimal Positions of ECG Electrodes in a Garment for the Design of ECG-Monitoring Clothing for Male, Hakyung Cho, Joo Hyeon Lee, Journal of Medical Systems, 2015, Vol.39(9), pp.1-14
4: Wearable Textile Electrodes for ECG Measurement, Lukas Vojtech, Radoslav Bortel, Marek Neruda, Milos Kozak, Advances in Electrical and Electronic Engineering, 01 January 2013, Vol.11(5), pp.410-414
5: Fabrication of conductive fabric as textile electrode for ECG monitoring, Yun Zhou, Xin Ding, Jingwei Zhang, Yaru Duan, Jiyong Hu, Xudong Yang, Fibers and Polymers, 2014, Vol.15(11), pp.2260-226
6: Vishay NTCLE100E3 NTC Thermistors Data Sheet, http://www.farnell.com/datasheets/1784420.pdf
Links
L7: http://www.analog.com/en/products/application-specific/medical/ecg/ad8232.html